Pages

Showing posts with label Population. Show all posts

Sunday, October 26, 2014

Overpopulation and Crime

For my last unit of my STEAM class Population, we learned about our population and how in 2050 it is estimated for there to be 10 billion people on earth. We also went over arithmetic and geometric sequences. Arithmetic is a sequence that uses addition and subtraction and geometric is when they use multiplication and division. Then, we went over different problems overpopulation might bring up like lack of food and water resources. Bringing me to the action project; we had to pick a topic that might become an issue with overpopulation. The issue I have chosen was crime and with this, I had to come up with a script to a comic strip on the issue. We also did the math together to see for ourselves on how many there would be exactly and we came up with 10,715,465,520. We used a geometric sequence because the number wasn't constant. This is a very good estimate, and something that could make the population higher is if we find more cures for diseases. What could lower it is if more diseases reach all around the world.

NVA "2050 population" 2014. Chicago


Mel, George "Crime" 2009. 

[Mark and Mary having dinner talking about different issues in the world, mainly crime at this point]

Mark: Hey, what do you think is the greatest cause of crime. I think it has to do with different things like politics or racism. (1)

Mary: Really? What about the overpopulation?

Mark: Not really because crime has to do with stuff that is happening around a person.

Mary: And you think overpopulation isn’t something that is happening around someone? Think about it, if we have an increase in people, then everyone is going have to fight for resources like food or water and might lead to thefts. Our lives would become a big competition. (2)

Mark: Maybe, but in the last couple of years crime has dropped 5% from 2008 to 2009, and if I’m not mistaken, population is always going up so that just makes that percentage grow. (3)

Mary: Yes, but think about it, the government would not be able to control our living conditions like they do now, meaning more crimes could happen, and the government wouldn't be able to do anything. That percentage just went down. (4)

[Mark looks around in the room]

Mark: I guess, because if the population did grow too much, this restaurant might not be here.

Mary: Don’t you see now... yes, maybe crime is caused by other factors but if so and the population grows, those problems would grow and cause more crime in an area. Crime and population affect each other all the time.

Mark: Hey Mary?

Mary: Yeah?

Mark: Can we move to the country side?

  1. “Top 10 Causes of Crime” Inferix. Top Yaps. n.d.
  2. “Effects of Human Population” n.p. Everything Connects. 2013
  3. “A Crime Puzzle: Violent Crime Declines in America” Claude Fischer. Berkeley Blog. 2010

Monday, October 13, 2014

To Mars

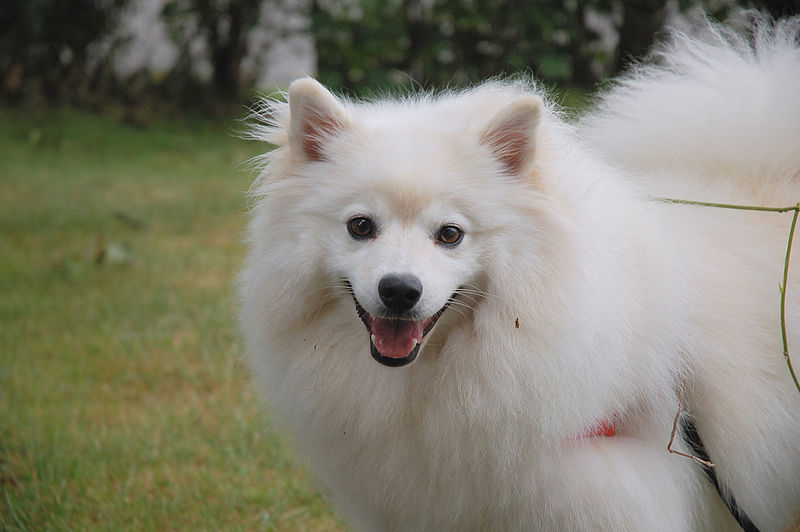
For Unit 2 of my Population class, we mainly went over central tendencies which consists of mean (average), max, min, range, mode, median, 1st quartile, and 3rd quartile. Then we learned how to put some of that information on a number line showing where they would be the name of this is a box and whisker plot. Next we learned about standard deviation which shows the quantity of something in a group and comparing it to a population of this thing. For the action project, we had to pick an animal from a rescue that is in our town and tell why we would think it would be best fit for Mars, also how it would help the Mars 1 project. The purpose of this action project was to show an animal would do in these kinds of conditions. My favorite thing about this project was that I got to learn more about Mars and its lands.


American_Eskimo_Dog_4.jpg
Mitch “American  Eskimo” 12 Sept, 2009. Internet: Wikimedia Commons


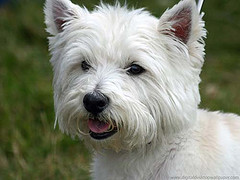
2694735953_660d835bce_m.jpg

“Westie”. July 23, 2009. Internet: Flickr


Since this animal would be living with humans, food, air, water problems would have been solved. That being the case, I believe it would best if the people settled in a dry plain area where the ground is flat. This would be best because there is more heat in the soil so when it gets fairly cold, it would be easy to get heat because there are no obstacles blocking it. If water does become a problem they can have something to extract the water in ice form from the ground. The animal I have chosen is in the video below.


From looking at The Chicago Canine Rescue, I will use the amount of years to show my data on the animals. Below is the box and whisker plot.

Mars 1 box and whisker.jpg

The standard deviation for this sample was 3.63 (3 years 7 months), and with a group with an average of 3.47, this shows that there is a very small age variance with the animals. With an outlier of about 3.98. The American Eskimo mixed with a Terrier is 3.63 standard deviations above the mean.

Wednesday, September 17, 2014

Atractosteus Spatula

For unit 1 of my new class Population, we have been learning about different ways we could use Venn diagrams to help with math, how to use sets when talking about math and using different symbols, and taxonomy which is the way to identify/name an animal. We also studied Jane Goodall by reading In Shadow of Man and seeing how she worked with the Chimps.The way scientist use taxonomy is by looking at the Kingdom, Phylum, Class, Order, Family, Genus, and Species, and these all have something that tells us how to specifically pick out an animal. For the action project, my teacher gave us a list of animals and everyone had to pick one animal. I happened to pick the Alligator Gar. Once, we had our animal we would have to then find out what Kingdom, Phylum, Class, Order, Family, Genus, and Species they belonged to. Then we would talk to other classmates and create a Venn diagram comparing the animals. Next we would have to make different sets and show how they belong to this set. Then, to show how our animal looked, we had to create a mosaic of our animal. The purpose of this was to see how scientists who classifies animals would do it.


NVA. "Alligator Gar" (2014)

NVA "Alligator Gar Venn Diagram" (2014)

NVA "Alligator Gar Set Notation" (2014)